.png)
As we settle into a new year, we look back on a successful 2025 and notably, a review of the market. Glenny’s Head of Commercial Agency, John Bell, gives his take:
‘Ahead of the launch of our Q3 2025 Databook we said that “the market was performing a bit like West Ham United’s season - they both look like they’ve turned a corner...but it’s just too soon to tell”.
Since then the Hammers have sunk into the relegation zone, whereas in contrast the market has shown signs of an improvement, with activity in H2 now above trend at 4.04m sq ft.
Our Key Q3 2025 Review Findings
•Lettings have been driven by a resurgence in the Big Box sector, with five deals completing in the second half of the year totalling 1.76m sq ft.
•The market for smaller units has also been busy with activity in lettings below 10,000 sq ft being 10% above trend at 1.93m sq ft.
•The Outer M25 market has been the major resurgence in activity, accounting for 65% (4.2m sq ft) of overall take up over the year.
•Inner M25 activity has also recovered, rising to 2.1m sq ft, an increase 41% on the previous 12 months.
•The increase in supply has been a major factor in the market over the past few years, with availability rising to an estimated 6.0% at the end of 2025. Geographically, availability is biased towards the Outer M25 market, which accounts for 57% of overall supply.
The impact of the November 2025 budget
Back in November, Rachel Reeves’ second budget was delivered and the much feared increases in direct taxation have not materialised. Rather, the tax burden has increased through a freeze on personal tax thresholds and a reduction in the upper limit for NI relief on salary sacrifice pension contributions.
The impact on business had been rather less marked following the increase in Employer’s National Insurance contributions introduced in 2024, with the major consequences arising from the removal of the Covid transitional relief for the Leisure and Hospitality sector on Business Rates to be replaced by a transitional period. This upward shift in Business Rates liability will be further compounded by the new Revaluation to be introduced in April 2026, meaning that most businesses will face higher Commercial Rates bills over the coming years.
The Office for Budget Responsibility (OBR) upgraded the expectations for growth in the UK economy for 2025 to 1.5%, but fiscal drag is expected to weaken the growth prospects over the coming years with activity downgraded.
The Eastern M25 Market in 2025 - a year of two halves
Previous years (2022 to 2024) have been a difficult period in the Eastern M25 industrial market, with activity levels remaining below trend levels at 4.9-5.4m sq ft , but last year saw a period of transition.
2025 was certainly a year of two halves, with take up in the first six months remaining at levels experienced in the post pandemic era and total of 2.3m sq ft of lettings (29% below trend), whilst H2 2025 has been a period of recovery with an estimated 24% above trend 4.04m sq ft of activity and a resurgent Big Box sector.
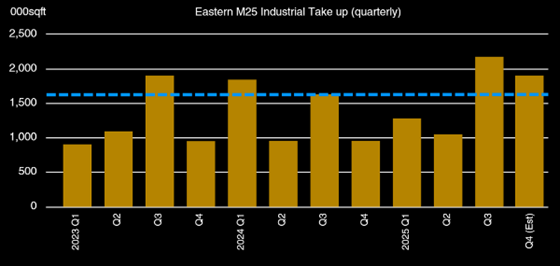
Take up is now currently estimated to be just below 6.4m sq ft, 18% up on the 5.4m sq ft recorded in 2024 and broadly in line with trend levels of activity.
The second half of 2025 was aided by a 820,000 sq ft pre let at DP World’s London Gateway and the letting of 439,230 sq ft at Panattoni Park, Sittingbourne but these two deals are not the only factor that has signified a turnround in take up, - with a total of five Big Box deals completing in H2 totalling 1.76m sq ft and bringing the year’s total to 2.06m sq ft in seven deals. The small lettings market (sub 10,000 sq ft) has also remained buoyant, with activity levels well above trend.
Big Box activity rebounds
The graph below examines activity over the course of 2025, and places it into the historic context of the past 12-15 years.
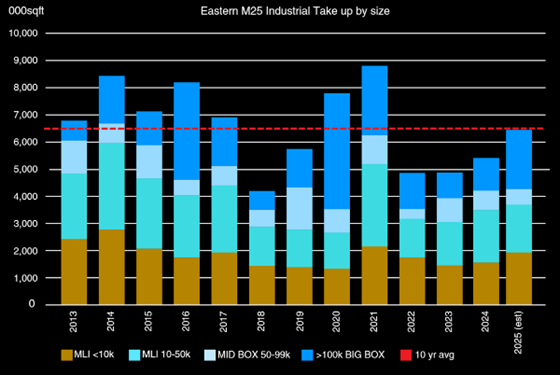
The immediate post pandemic period 2020/21 saw take up move to record levels but 2022-24 was one of the weakest performance periods in the Eastern M25 market in recent history. The low levels of activity over the past three to four years were primarily attributable to a slow down in the Big Box and Mid Box markets but H2 2025 has seen this partially reversed.
The table below illustrates 2025 activity by the size of letting and compares it to the 10 year average for each size band.
| 000 sq ft | 2025 Est | 10yr Avg | +/- Trend |
| <10 sq ft | 1,933.7 | 1,758.0 | +10% |
| 10-50k sq ft | 1,798.8 | 2,018.4 | -11% |
| 50-99k sq ft | 602.9 | 841.8 | -28% |
| >100k sq ft | 2,063.3 | 1,892.2 | +9% |
| Total Eastern M25 | 6,399.2 | 6,510.4 | -2% |
Overall, take up over 2025 was marginally below trend levels, but activity was 30% higher than the troughs of 2022/23. The weakest levels of activity have been seen in the Mid Box sector, where take up was 28% below trend levels, whilst the sub 10,000 sq ft multi let industrial market saw strong performance with lettings 10% ahead of trend.
Geography is key
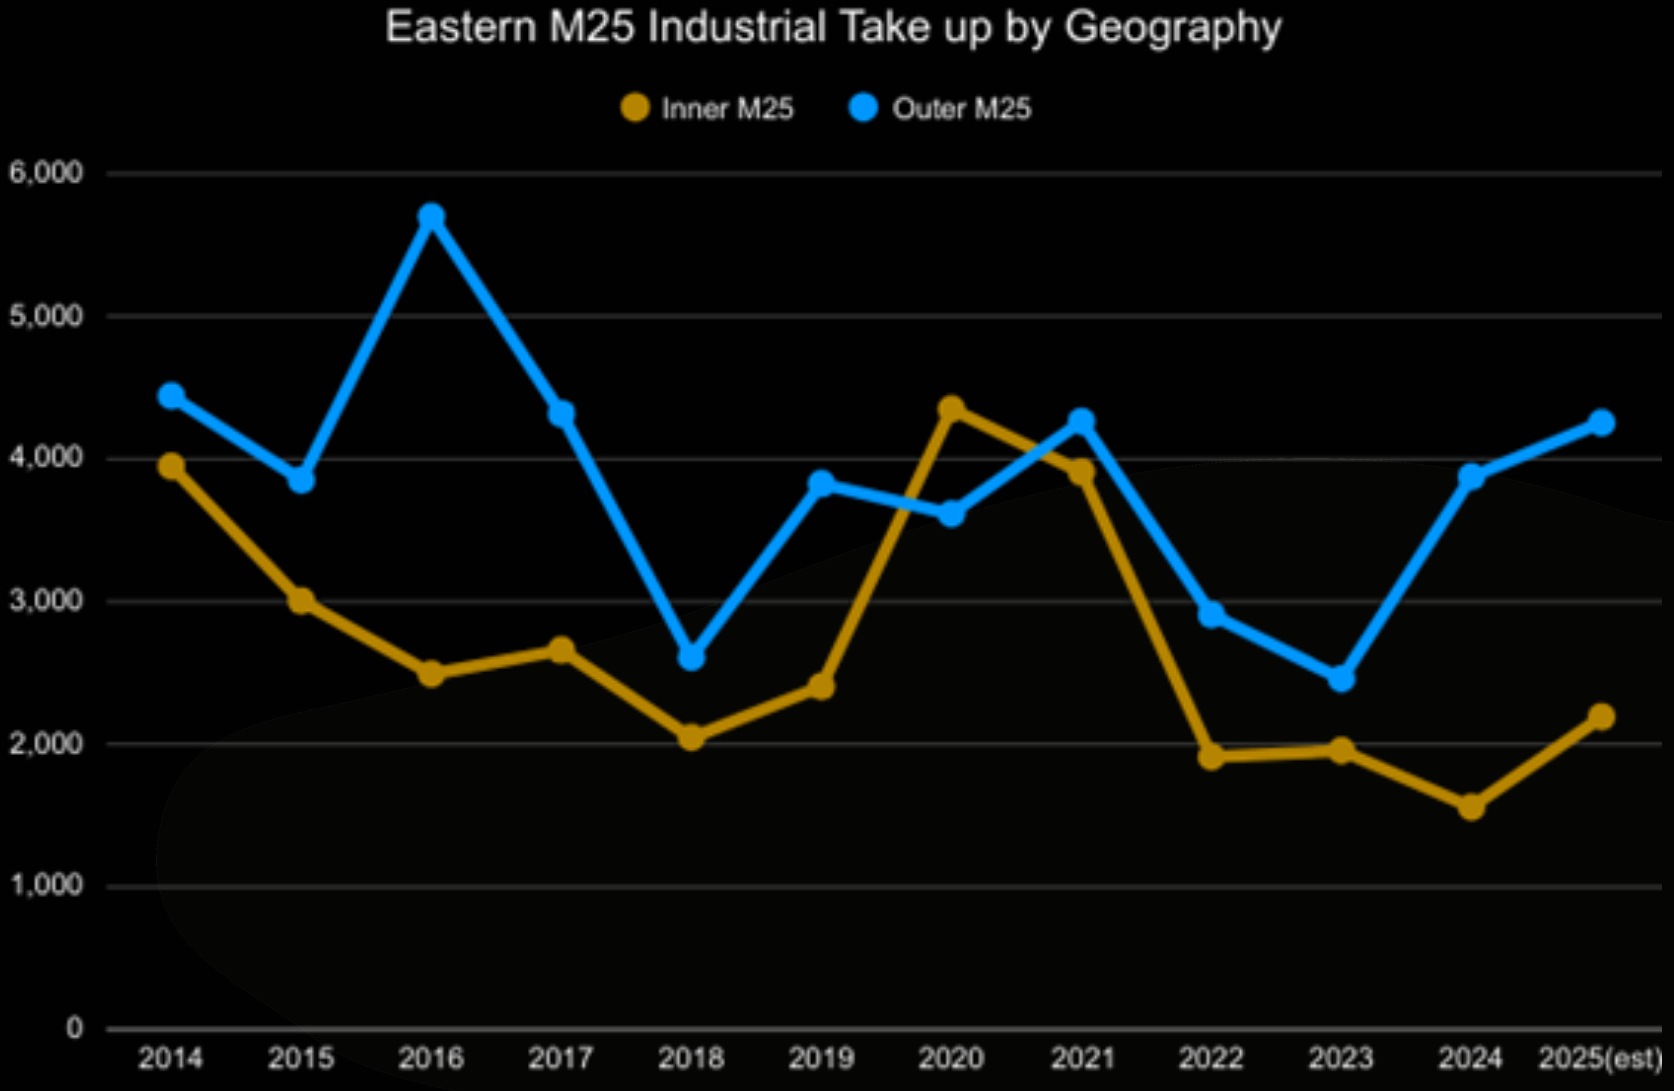
The graph above illustrates the trends in take up between the Inner and Outer M25 markets across the Glenny Region. Whilst both markets saw a slowing in activity in the period 2022-24, the most significant slowing has been seen in the Inner M25 market, where activity halved from the peak years of 2020/21.
The Outer M25 market also saw a reduction in the levels of take up - down by 40% but activity rebounded in 2024 and last year to 4.2m sq ft. Take up in the Outer M25 market is 11% ahead of trend levels, whilst activity in the Inner M25 market is 17% below trend.
Overall, take up for 2025 was marginally below trend levels but activity was 30% higher than the troughs of 2022/23. The weakest levels of activity have been seen in the Mid Box sector, where take up was 28% below trend levels, whilst the sub 10,000 sq ft multi let industrial market saw strong performance with lettings 10% ahead of trend.
Supply increased
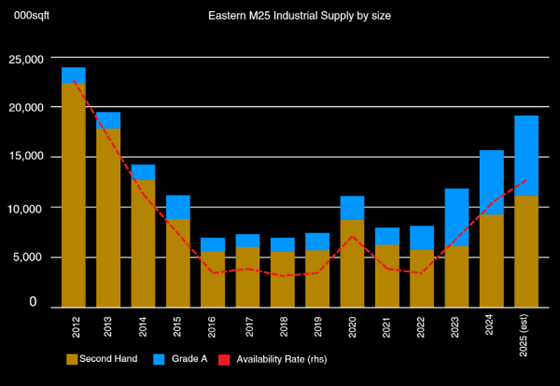
One of the major market trends in the Eastern M25 over the past few years has been the sharp upturn in supply, which has primarily been driven by an increase in Grade A space to 7.3m sq ft at the end of 2025, up from 2.0m sq ft at the end of 2021. Second hand supply has also increased in recent months rising from 7.2m sq ft in 2023 to an estimated 11.8m sq ft for the end of last year.
Whilst there has been a significant upturn in supply, overall availability still remains below the peak levels of 2012. The overall availability rate stands at 6.0% as at 2025 compared to the high point of 8.3% in 2012.
The main focus of supply
| 000 sq ft | Inner M25 | Outer M25 | Eastern M25 Total |
| <10k sq ft | 1,299.5 | 1,893.3 | 3,192.8 |
| 10-50k sq ft | 3,355.4 | 3,857.2 | 7,212.6 |
| 50-99k sq ft | 1,821.8 | 2,010.4 | 3,832.2 |
| >100k sq ft | 1,832.0 | 3,108.6 | 4,940.7 |
| Total Eastern M25 | 8,308.8 | 10,869.5 | 19,178.3 |
| Share of Total Supply | 43.3% | 56.7% | 100.00% |
| Availability Rate (est) | 7.9% | 5.0% | 6.0% |
Current supply is biased towards the Outer M25 region, accounting for 10.9m sq ft - 57% of overall supply. However, this sector of the Eastern M25 market has a lower availability rate, which stands at 5.0%, compared to 7.9% (8.3m sq ft) in the Inner M25 market.
The Q3 2025 Glenny Databook is available now. Click here to download your copy.